May 10, 2023
A Look at the Debt Ceiling
Tim Urbanowicz, CFA
Head of Research & Investment Strategy
Innovator Capital Management
In the midst of all the other issues investors are attempting to navigate in 2023, the deadline for the debt ceiling is quickly approaching. While the limit was technically already hit in January, the Treasury was able to take “extraordinary measures” to kick the can down the road. Treasury Secretary, Janet Yellen, now estimates that funds will dry up as early as June 1st. It’s May 10th…and June is right around the corner. While a deal is likely, partisan lines have hardened and investors should not take the solution as a given this time around. So, where does each side stand? What do they have to lose? In this month’s blog, we dive into these questions and look at what it all means for investors.
A Look at Both Sides
Democrats
Democrats are in a tricky position. They are likely going to have to agree to some level of spending cuts to get a deal done, and those spending cuts will not bode well for their hopes of reelection in 2024. Outside of being unpopular among their base, spending cuts also increase the probability of a recession, and a recession in the last two years of a presidential term has almost always led to a losing reelection bid (only 1 exception since 1900). So, spending cuts aren’t great for them, but on the other hand, no deal, would be catastrophic for the economy and certainly not something President Biden will want taking place on his watch. Twenty years from now, people may or may not remember who was in Congress when the US defaulted on its debt, but they will certainly remember who was in the White House.
Non-negotiables for the democrats likely include cutting subsidies included in the Inflation Reduction Act (creative name for a spending bill) and above all, pushing the next fight on the ceiling out past the elections in November of 2024. There is no way they are going to want to fight this battle twice, pre-election.
Republicans
Republicans are in a unique spot. The bigger the spending cuts they can get Democrats to agree to, the greater the chances of a recession and financial market chaos/volatility prior to the 2024 election; both of which may help their chances. Elevated inflation also gives Republicans a way to rationalize spending cuts, and a simple way to defend their position to the public. Government spending fuels inflation.
On April 26th, House Republicans passed the “Limit, Save, and Grow Act”, which focused on capping discretionary spending, slashing subsidies, and imposing work requirements for welfare. Many of the proposed alterations fall into the “non-negotiable” category for Democrats, and are highly unlikely to get through. While Republicans may have an edge, they don’t hold all the cards, as they will still shoulder a chunk of the blame.
It is encouraging to see President Biden and House Speaker McCarthy begin talks. It’s a good start…but there is a lot of work to do, as both sides are a ways apart and the political stakes are extremely high.
What to Expect from Capital Markets?
What should we expect from capital markets? I’ll sum it up in one word…volatility. Even though an agreement is likely to be reached, with everything at stake politically, don’t expect it to get done with much time left on the clock. And the longer we go without a deal, the higher volatility is likely to go.
The charts below show the spike in equity volatility we saw around the projected “X” date back in 2011 and 2013. In 2011, the VIX spiked 63% in the months leading up to the “X” date, and in 2013, it spiked 71%. In both instances, negotiations came right down to the wire.
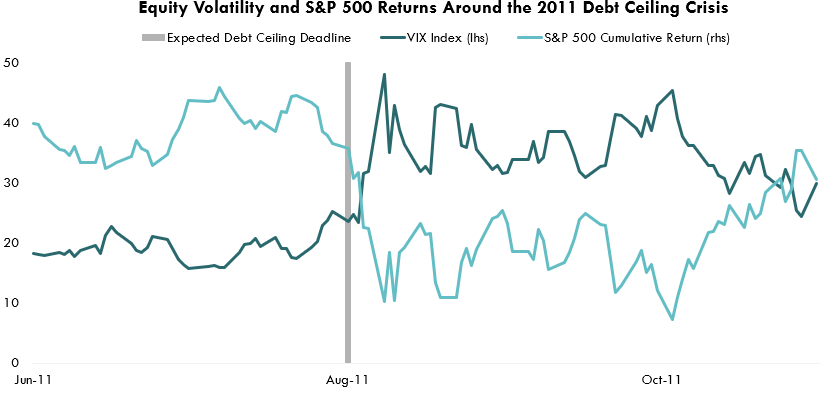
Source: Bloomberg LP, CBOE VIX Index, S&P 500 Index, 6/1/2011-10/31/2011
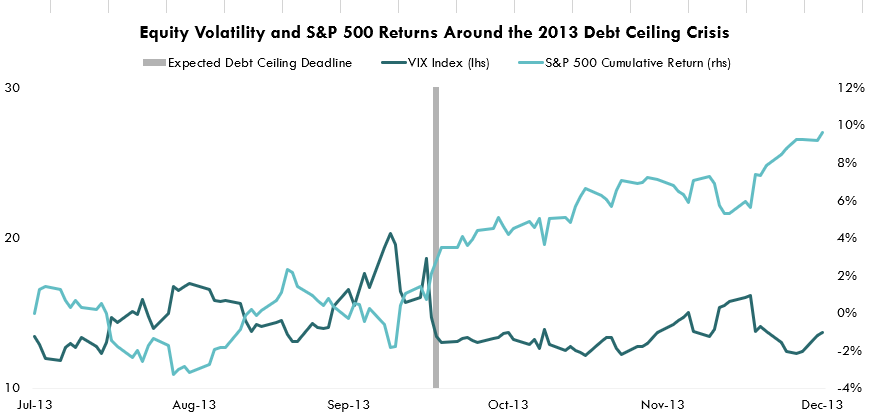
Source: Bloomberg LP, CBOE VIX Index, S&P 500 Index, 7/31/2013-12/31/2013
Bonds also saw a big uptick in volatility leading up to the potential crisis. The ICE BofA Move Index, a broad measure of volatility across the treasury curve, saw an increase right alongside the VIX, spiking 24% throughout the 2011 and 57% throughout the 2013 crisis.
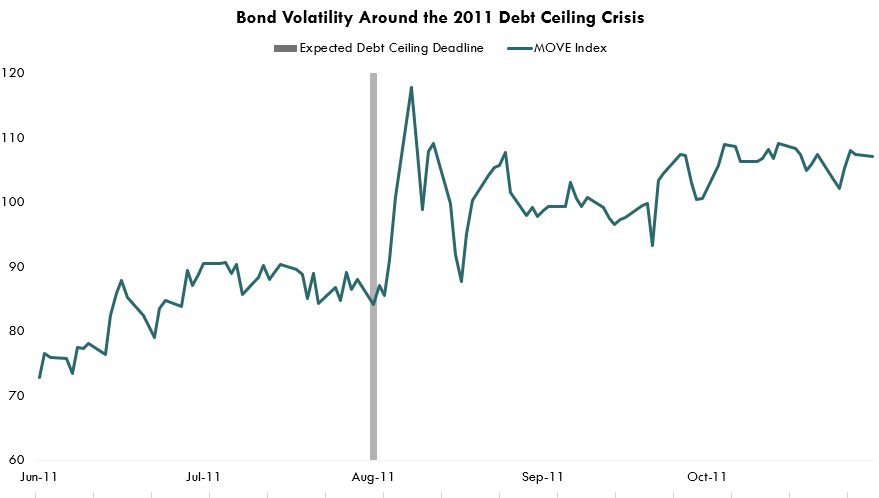
Source: Bloomberg LP, ICE BofA MOVE Index, 6/1/2011-10/31/2011
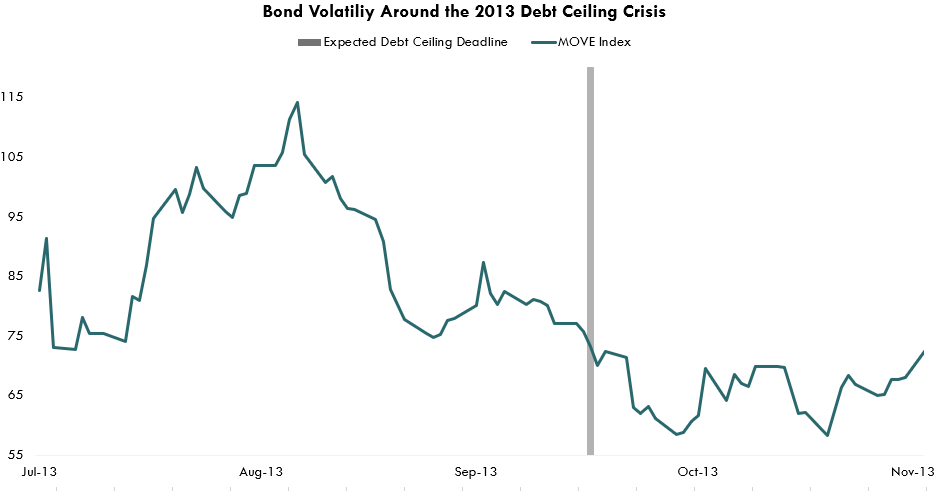
Source: Bloomberg LP, ICE BofA MOVE Index, 7/31/2013-12/31/2013
When it comes to bonds, we have already seen some funky action, particularly on the shorter end of the curve. The 1-month treasury saw a 1.31% decrease from the beginning of April to the 21st. Meanwhile, over the same time frame, every other maturity saw yields increase. This was potentially a reflection of investors buying up the 1-month treasury as its maturity occurred before the perceived “X” date. Ever since April 21st, the yield on the 1-month treasury has rocketed higher, and as I write, is currently 2.2% higher than it was on the 21st.
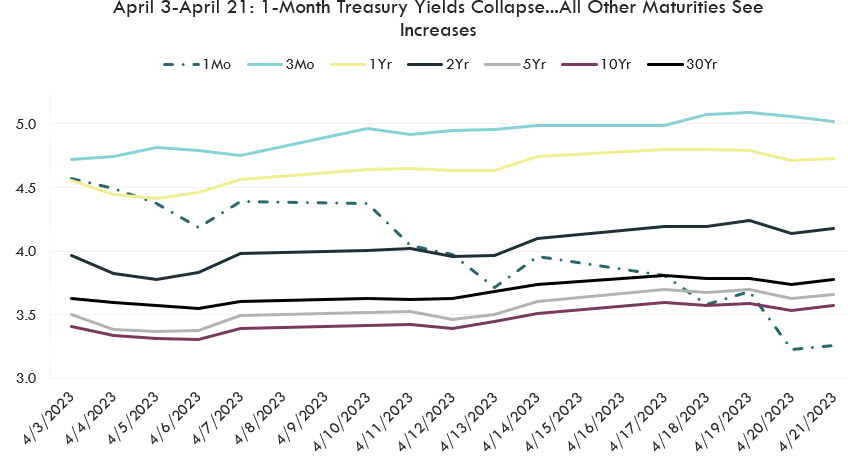
Source: Bloomberg LP as of 4/21/2023, Generic US Treasury Yield by Maturity
Is this Time Different?
Is this time different? Hopefully not, but partisan lines are much firmer than they were back in 2011 or 2013. Ultimately this may mean greater uncertainty and higher volatility.
And for the first time ever, I don’t think we can, nor do I believe market participants will, take a timely solution to the conflict as a given.
No one knows what a technical default might hold for markets. The payments on “risk-free” debt are assumed. If that were to change, I don’t know what would happen, but I do know it wouldn’t be good and may potentially come with longer term consequences. The contingency plan in 2011 prioritized interest payments on Treasuries, while delaying other payments. I assume that would be the same this time, but hopefully we don’t need to find out!
So, what can we do as investors? As we wait, we can position portfolios for near term volatility, and hope for a reasonable, long-term solution to the national debt crisis.
The debt ceiling is a limit that Congress imposes on the amount that the federal government can owe.
CBOE VIX Index, or VIX, measures the short-term (30-day) market volatility of the option prices of the S&P 500 Index (SPX), taken from a range of both call and put options.