January 9, 2023
The Back Half of the Hike Cycle
In an effort to compensate for a severely delayed start, the Fed has hiked interest rates at the most aggressive pace in modern history. Historically, hike cycles have varied in length, ranging anywhere from 9 months to 5 years with an average duration of 2 years. With the aggressive start in 2022 and inflation slowly starting to come down, we are optimistic that we are in fact in the later stages of the tightening cycle. How should investors be thinking about positioning at this point? In this week’s commentary, we dive into this question by examining key trends in the back half of historical Fed hike cycles.
Interest Rates
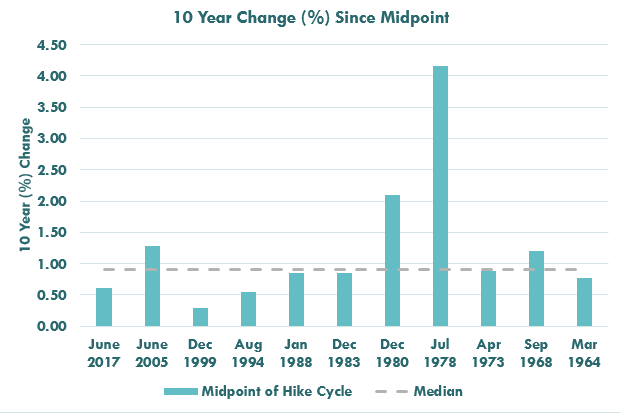
As expected, interest rates across the curve rise during hiking cycles and historically, the back half has been no exception. Looking at the 10-year treasury as an example, yields have risen in the back half of the cycle 100% of the time, with a median increase of 0.90%. We also see that the yield curve tends to flatten, with the spread between the 3-month and 10-year yield compressing an average of 1.1%.

Source: Bloomberg LP, US Generic 10 Year Treasury Yield, 3/1/1964-6/30/2017
As the cycle wraps up, however, results have varied. Isolating the last three months, the 10-year yield has still risen an average of 0.30%, however, in 45% of cases, the yield actually decreased.
Equity Valuations
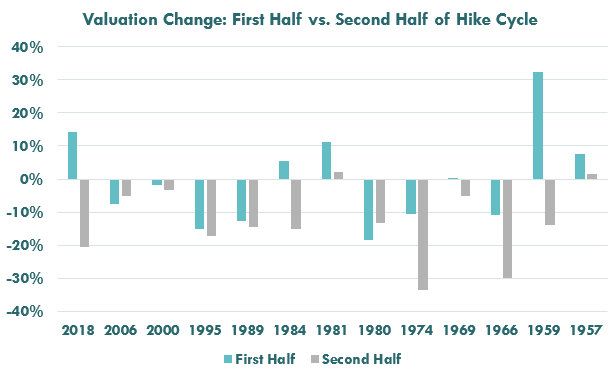
Equity valuations have been fairly consistent near the end of Fed tightening cycles, as shown in the table below. In the latter half of 11 of the last 13 hike cycles, valuations have fallen, with a median contraction of 14%. There have only been two instances, the cycles beginning in 1954 and 1980, where valuations increased, and they did not move much. In both instances, valuations increased a mere 2%.

Source: Bloomberg LP, S&P 500 Index, 10/1/1957-12/31/2018
While contractions have been less severe as hike cycles come to an end, the overall direction has been very consistent. Isolating the final three months of each cycle, valuations contracted in 9 of the 13 with a median contraction of 2%. Regardless of where we are at in the cycle today, we believe investors should not anticipate a boost in equity returns driven by multiple expansion.
Equity Returns & Earnings Growth
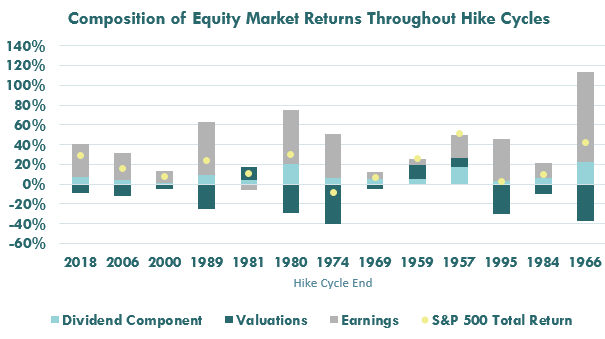
Equity returns have generally been positive throughout Fed tightening cycles, averaging 11% point to point over the last 13. As shown in the chart below, returns have primarily been driven by robust earnings growth.

Source: Bloomberg LP, S&P 500 Index, 11/1/1966-12/31/2018
Later in the cycle, returns have been significantly lower, averaging just +1% in the second half and -2% in the final three months. Earnings growth has remained positive in all but three cycles and has generally trended lower after the cycle comes to an end.

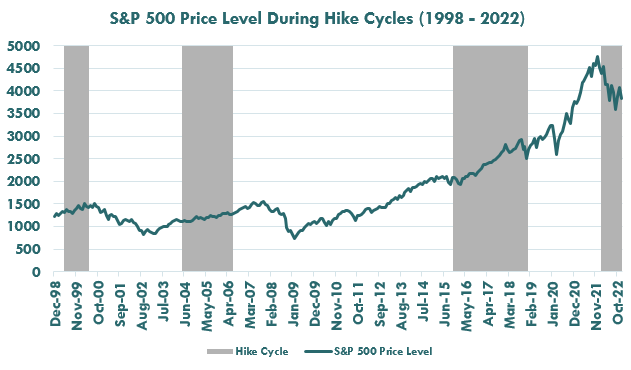
Bloomberg LP, 12/1/1998-10/31/2022
Portfolio Positioning
With late hike cycle dynamics potentially in play for 2023, we find value in strategies that seek to accelerate positive returns and also buffer downside losses. Should interest rates, valuations, and earnings follow the historical late cycle playbook, strategies such as XBJA, the Innovator US Equity Accelerated 9% Buffer ETF - January, may be an option to consider. XBJA seeks to provide investors 2X the upside exposure to SPY, the SPDR S&P 500 ETF Trust, up to an 18.18% cap, with a 9% buffer against losses over the outcome period.
The funds only seek to provide their investment objective, which is not guaranteed, over the course of an entire outcome period. Investors who purchase shares after or sell shares before the end of an outcome period will experience very different outcomes than the funds seek to provide.
The Funds have characteristics unlike many other traditional investment products and may not be suitable for all investors. For more information regarding whether an investment in the Fund is right for you, please see "Investor Suitability" in the prospectus.
The ETFs can be held indefinitely, resetting at the end of each outcome period. There is no guarantee the funds' will achieve their investment objective.
The Funds face numerous market trading risks, including active markets risk, authorized participation concentration risk, buffered loss risk, cap change risk, capped upside return risk, correlation risk, liquidity risk, management risk, market maker risk, market risk, non-diversification risk, operation risk, options risk, trading issues risk, upside participation risk and valuation risk. For a detail list of fund risks see the prospectus.
FLEX Options Risk The Fund will utilize FLEX Options issued and guaranteed for settlement by the Options Clearing Corporation (OCC). In the unlikely event that the OCC becomes insolvent or is otherwise unable to meet its settlement obligations, the Fund could suffer significant losses. Additionally, FLEX Options may be less liquid than standard options. In a less liquid market for the FLEX Options, the Fund may have difficulty closing out certain FLEX Options positions at desired times and prices. The values of FLEX Options do not increase or decrease at the same rate as the reference asset and may vary due to factors other than the price of reference asset.
XBJA: If the Outcome Period has begun and the Fund has experienced an accelerated return, an investor purchasing Shares at that price may be subject to losses that exceed any losses of the Underlying ETF for the remainder of the Outcome Period and may have diminished or no ability to experience further accelerated return, therefore exposing the investor to greater downside risks.
These Funds are designed to provide point-to-point exposure to the price return of the Reference Asset via a basket of Flex Options. As a result, the ETFs are not expected to move directly in line with the Reference Asset during the interim period.
Investors purchasing shares after an outcome period has begun may experience very different results than funds' investment objective. Initial outcome periods are approximately 1-year beginning on the funds' inception date. Following the initial outcome period, each subsequent outcome period will begin on the first day of the month the fund was incepted. After the conclusion of an outcome period, another will begin.
Fund shareholders are subject to an upside return cap (the "Cap") that represents the maximum percentage return an investor can achieve from an investment in the funds' for the Outcome Period, before fees and expenses. If the Outcome Period has begun and the Fund has increased in value to a level near to the Cap, an investor purchasing at that price has little or no ability to achieve gains but remains vulnerable to downside risks. Additionally, the Cap may rise or fall from one Outcome Period to the next. The Cap, and the Fund's position relative to it, should be considered before investing in the Fund. The Funds' website, www.innovatoretfs.com, provides important Fund information as well information relating to the potential outcomes of an investment in a Fund on a daily basis.
The Fund only seek to provide shareholders that hold shares for the entire Outcome Period with their respective buffer level against reference asset losses during the Outcome Period. You will bear all reference asset losses exceeding the buffer. Depending upon market conditions at the time of purchase, a shareholder that purchases shares after the Outcome Period has begun may also lose their entire investment. For instance, if the Outcome Period has begun and the Fund has decreased in value beyond the pre-determined buffer, an investor purchasing shares at that price may not benefit from the buffer. Similarly, if the Outcome Period has begun and the Fund has increased in value, an investor purchasing shares at that price may not benefit from the buffer until the Fund's value has decreased to its value at the commencement of the Outcome Period.