May 9, 2023
Money In, Money Out
As investors are still grappling with the March banking crisis, another concern may be on the horizon: the supply of money. M2 is a measure all cash on hand plus money deposited into checking, savings, and other short-term accounts that can be liquidated in less than a year. In this week’s What to Watch, we examine the recent drop in M2 and what it means for the economy and investors moving forward.
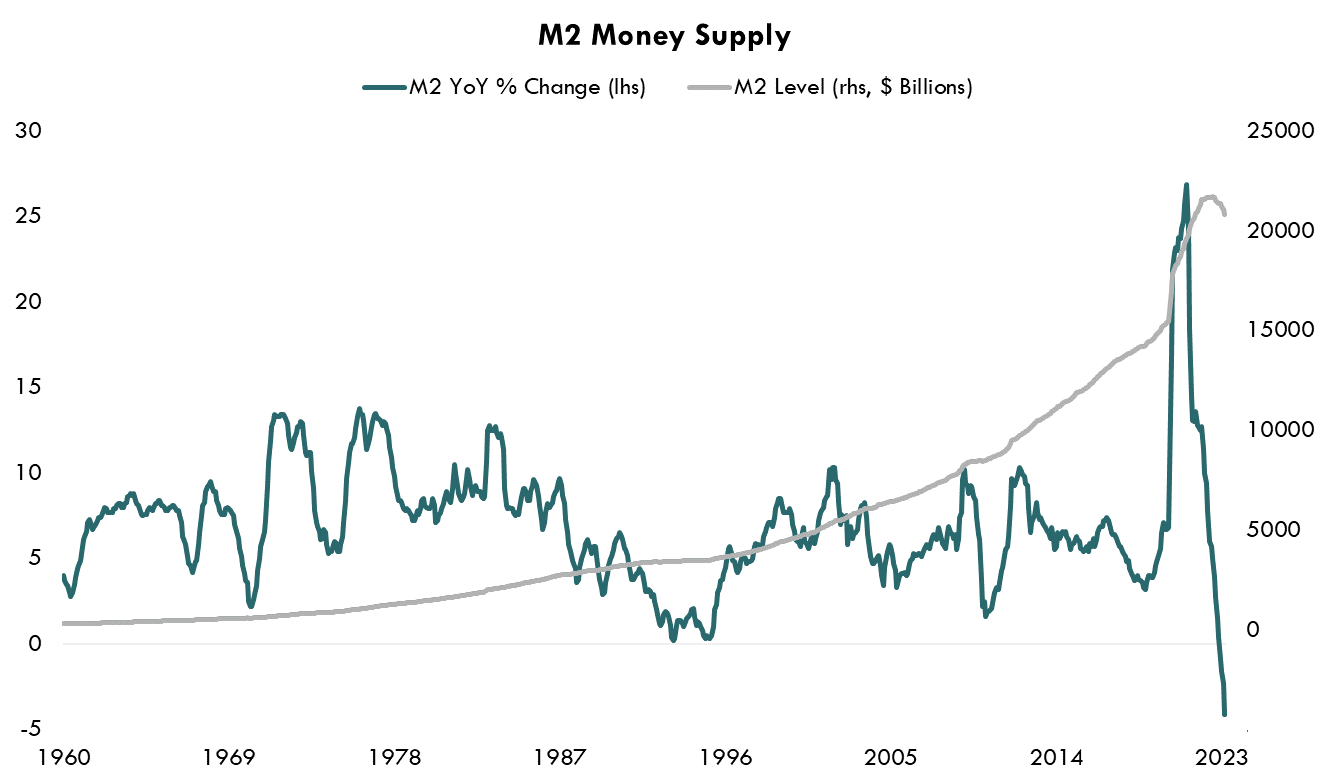
Source: Bloomberg LP, M2% YOY Index, M2 Index, as of 1/31/1960 – 3/31/2023
What the Fed is Doing is Working
M2 has often been used as an indicator of future inflation and economic activity, as the amount of money in circulation has a positive correlation with inflation. Due to the reckless government spending during the pandemic, M2 grew at an unprecedented year-over-year rate of over 25% in 2021. In April and May of 2020, M2 shot up over 6% and 5% on a month-over-month basis, which is in the 99th percentile of all monthly changes. About two years after the stimulus spending, M2 finally peaked in July of 2022, dropping over 4%. To put this move into context, since 1960, it had never contracted. The Fed has had a direct impact on the money supply, as it has risen rates and tightened its balance sheet.
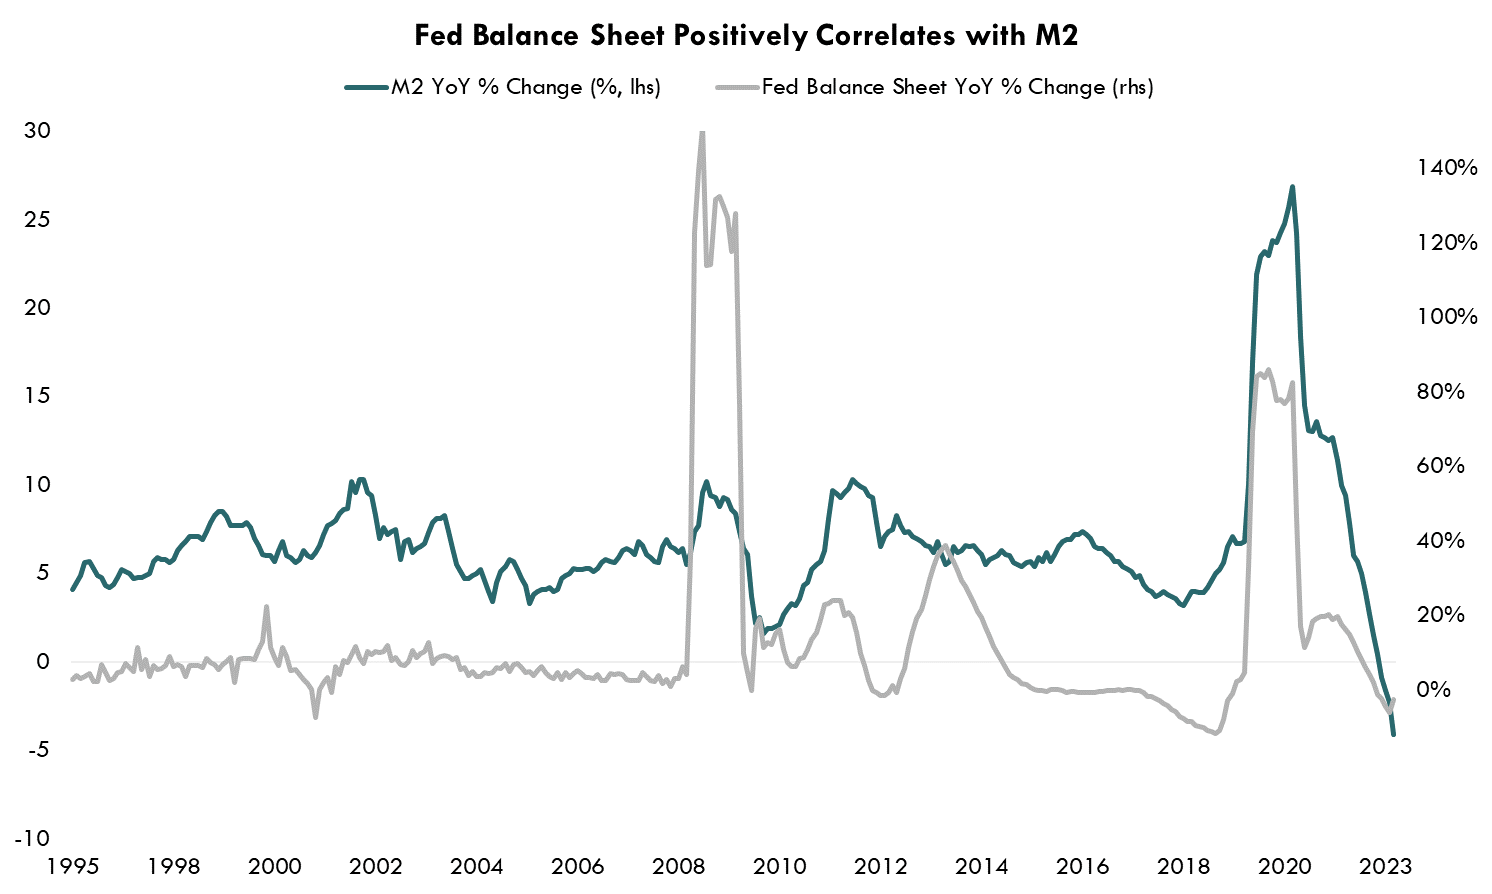
Source: Bloomberg LP, M2% YOY Index, FARBAST Index, as of 12/31/1995 – 3/31/2023
In our last What to Watch, Revisiting Inflation, we highlighted how goods inflation has been decreasing at a faster pace than headline inflation. This trend can partly be attributed to the significant decrease in M2. Less money in circulation leads to less money for consumers to spend on goods. While this is a necessity to continue combating inflation, too much of a contraction in M2 can be very dangerous for the economy.
Uncharted Waters
Negative year-over-year growth in M2 has been very rare, historically, as there have only been six prior instances, where we have seen a contraction. Outside of the current contraction, no other contractions have occurred since 1958. It is also important to note that all other contractions have occurred either during a depression or at minimum, a recession.
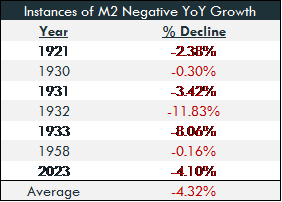
Source: FRED, United States Census Bureau, as of 1/1/1900 – 3/31/2023
For the consumer and the economy as a whole, this may be at troubling sign. Banks have started to see velocity of withdrawals increase as depositors gravitate to bonds and other higher yielding securities. As a result of falling deposits and higher uncertainty, banks are significantly tightening their lending standards, which will have a further impact on the amount of dollars in circulation in the economy.
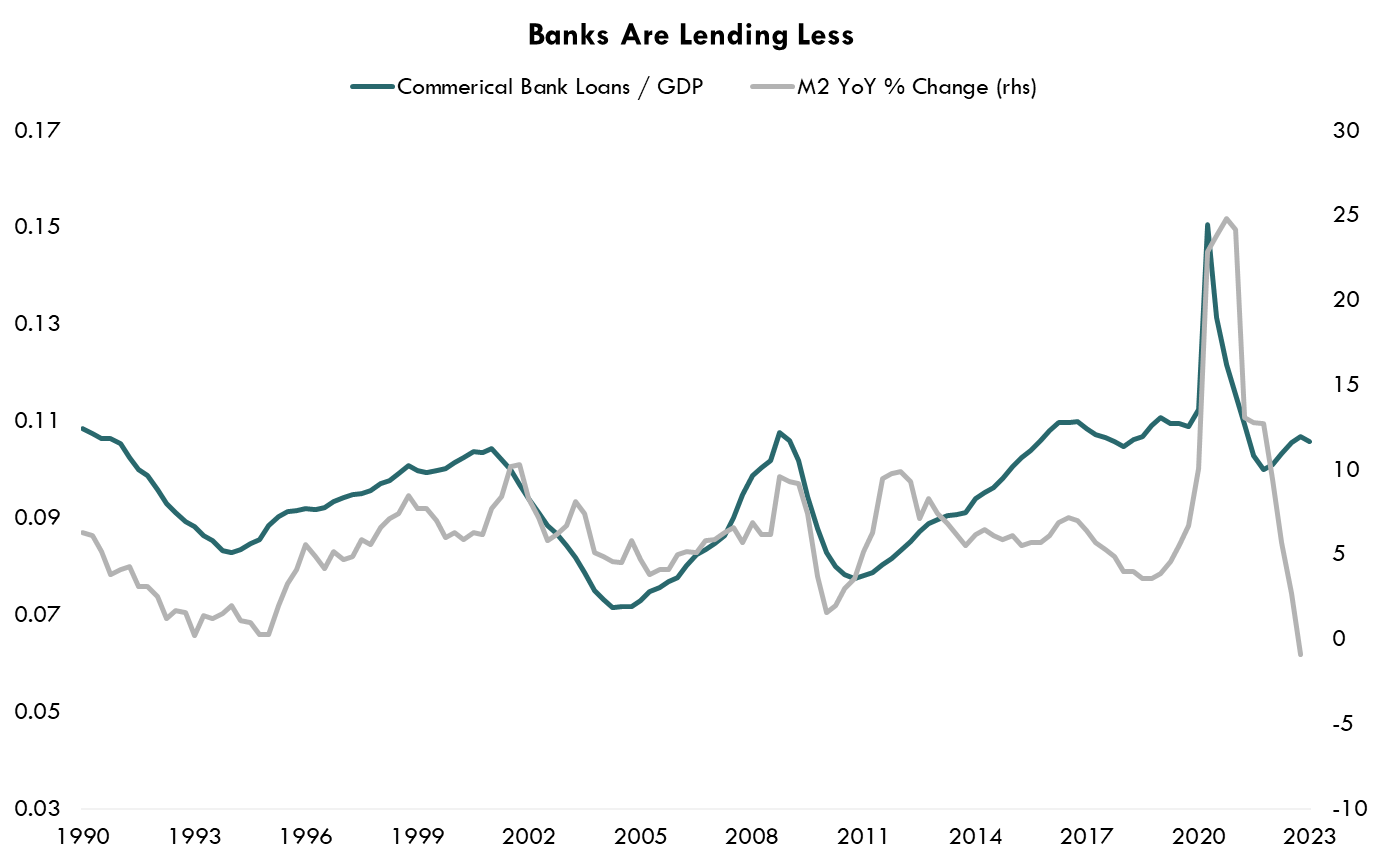
Source: Bloomberg LP, FRED, M2% YOY Index, BUSLOANS, as of 1/1/1990 – 1/1/2023
Adjusting for inflation - by dividing the Commercial Bank Loans by nominal GDP, the graph above shows the relationship M2 has on commercial bank loans. It provides further evidence that M2, deposits, and commercial bank loans are all connected. With the Fed raising rates aggressively and bank deposits decreasing, commercial bank loans have begun to drop which could result in a widespread credit crunch.
Bottom Line
There’s a lot of uncertainty on what negative year-over-year growth in M2 could mean for the economy. On one hand it could help lower inflation, but on the other hand, the decrease can wreak havoc on the economy, as did each of the last 6 times M2 decreased in the past. For investors, one thing remains clear, uncertainty is high, and investors should continue to take a cautious stance when it comes to their portfolio.