January 20, 2023
Positioning Amidst the Disconnect
2022 was all about interest rates. Looking at the contributions to the 18% sell off in the S&P 500 Index for the year, we see that valuations drove over 100% of the decline. The forward price to earnings ratio contracted 20%, while dividends contributed a positive 1.3% and consensus earnings estimates fell slightly (<1%). As shown below, the move higher in interest rates was the driving force behind the decline in valuations, with the two moving in opposition (note inverted axis in graph below).
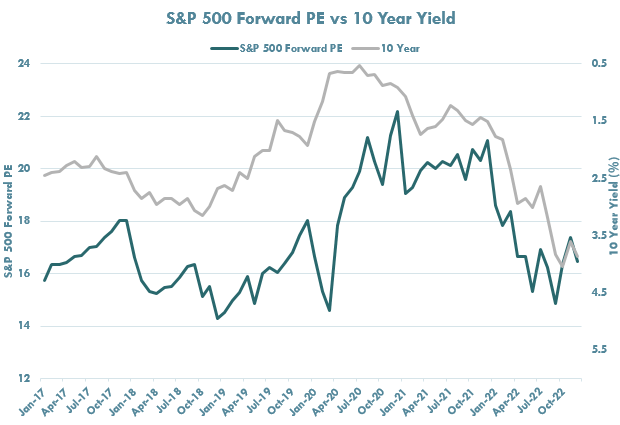
Source: Bloomberg LP, 1/17/2023, Innovator Research & Investment Strategy
The strong equity rally to start 2023 has been no different. Bond yields have moved lower, resulting in higher valuations, and the S&P 500 Index gained 4% in the first 10 trading days. This begs the question, is the move down in rates sustainable? We don’t think so. While there is a narrow path to justify the recent move, we believe investors should position their portfolios accordingly, where rates may be structurally higher for longer.
The Disconnect: Market Expectations vs. Fed Expectations
The market’s stance on Fed expectations is very aggressive; as shown below, current expectations are for two additional 0.25% hikes in February and March, leading to a peak rate of 4.75%-5%, and a subsequent transition to cuts in the back half of the year. Comparing this to the Fed’s own expectations (right chart), we see a very different narrative. The median dot in December of 2023 rests at 5.125%, with only two of 19 members below the 5% threshold. Unless we see a meaningful uptick in unemployment and a pullback in spending and production, we do not see the bond market on the right side of this discrepancy.
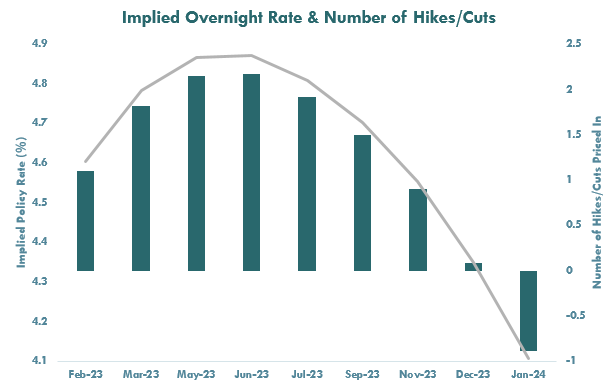
Source: Bloomberg LP, 1/17/2023, Fed Fund Futures |
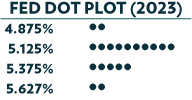
Source: Bloomberg LP, 1/17/2023 |
What could this mean for the longer end of the yield curve? Assuming the current inversion of 1%, this recalibration would put the 10-year yield back up around 4.25%. Assuming the median historical spread between the Fed Funds Rate and the 10-year of 1.5%, the 10-year yield would be near 6.75%. Regardless, this reconnection would require a repricing of both equities and bonds.
Why the Transition to Cuts Will Likely be Slower than Expected
Inflation appears to have peaked, however, even with the recent decline, the Fed funds rate is still below the rate of inflation. The gap may be less extreme than it was a year ago, but it remains the widest we have seen since 1954.
It should also be noted that over the last 50 years, the Fed has never stopped hiking rates with the Fed Funds rate below the Consumer Price Index (CPI).”
The fight is not done and there is still a long way to go as the most recent print* was still nearly 3X higher than the Feds target.
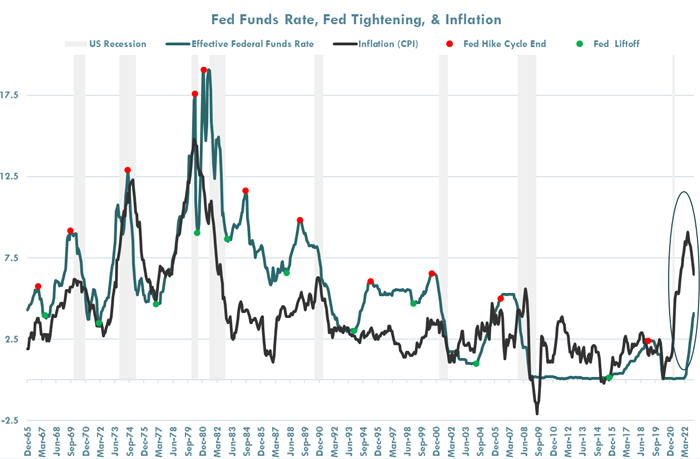
Source: Bloomberg LP, 1/17/2023, Innovator Research & Investment Strategy, Consumer Price Index, Federal Funds Rate, NBER Recessions, Data from 12/31/1965-12/31/2022
We also believe the Fed will be cautious not to make the same mistakes made in the 1970’s & 1980’s, and hence, the transition to rate cuts may be slower than the market expects. As highlighted in the chart below, over this decade plus, there were several instances (red circles) where the Fed started to cut rates after an apparent inflation peak, only to see a resurgence shortly after. This history lesson will be fresh in minds of Fed officials.
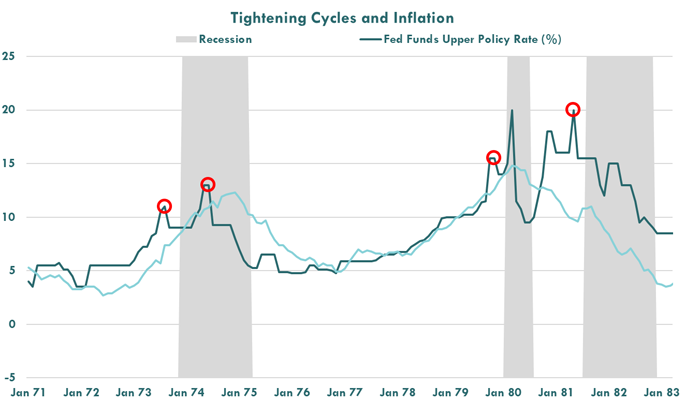
Source: Bloomberg LP, 1/17/2023, Innovator Research & Investment Strategy, Consumer Price Index, Federal Funds Rate, NBER, data from 12/31/1971-12/31/1982
Portfolio Positioning Solutions
In light of these current market dynamics, below are three key implications for portfolios along with potential implementation strategies.
Complement Bond Exposure
We continue to see a world where interest rates will drive equity markets up and down, and therefore, challenge traditional stock/bond diversification benefits. However, unlike 2022 when yields were unattractive, bonds now display a better risk/reward tradeoff. As such, we favor complementing traditional fixed income exposure with alternatives, and remain cautious on adding duration to a portfolio. We believe strategies such as BALT, the Innovator Defined Wealth Shield ETF, which provided a positive total return of 2% in 2022, may continue to be a valuable complement to traditional fixed income exposure.
Current performance may be higher or lower than that quoted. Visit innovatoretfs.com/performance for current month-end performance.
Hedge Repricing Risk
Should interest rates revert higher, equities may reprice and give back recent gains. Buffer ETFs such as PJAN, the Innovator U.S. Equity Power Buffer ETF, which seeks a 15% downside buffer and an 18.84% upside cap on SPY over the 12-month outcome period, may be a timely idea to keep clients invested and also hedge any potential repricing that comes from a yield increase.
Position for Muted Returns
Without falling interest rates boosting equity valuations, investors may be left relying on earnings growth and dividends to source returns in 2023. Given a current dividend yield of 1.6% and consensus estimates calling for low single digit earnings growth, traditional beta exposure may not produce acceptable equity returns. Accelerated strategies such as XBJA, the Innovator U.S. Equity Accelerated 9 Buffer ETF, may help combat this dynamic by doubling the returns of SPY up to an 18.18% cap, and providing a 9% buffer on the downside.
*Core Personal Consumption Index (PCE) - the Fed preferred measure of inflation.
The funds only seek to provide their investment objective, which is not guaranteed, over the course of an entire outcome period. Investors who purchase shares after or sell shares before the end of an outcome period will experience very different outcomes than the funds seek to provide.
The Funds have characteristics unlike many other traditional investment products and may not be suitable for all investors. For more information regarding whether an investment in the Fund is right for you, please see "Investor Suitability" in the prospectus.
The ETFs can be held indefinitely, resetting at the end of each outcome period. There is no guarantee the funds' will achieve their investment objective.
The Funds face numerous market trading risks, including active markets risk, authorized participation concentration risk, buffered loss risk, cap change risk, capped upside return risk, correlation risk, liquidity risk, management risk, market maker risk, market risk, non-diversification risk, operation risk, options risk, trading issues risk, upside participation risk and valuation risk. For a detail list of fund risks see the prospectus.
FLEX Options Risk The Fund will utilize FLEX Options issued and guaranteed for settlement by the Options Clearing Corporation (OCC). In the unlikely event that the OCC becomes insolvent or is otherwise unable to meet its settlement obligations, the Fund could suffer significant losses. Additionally, FLEX Options may be less liquid than standard options. In a less liquid market for the FLEX Options, the Fund may have difficulty closing out certain FLEX Options positions at desired times and prices. The values of FLEX Options do not increase or decrease at the same rate as the reference asset and may vary due to factors other than the price of reference asset.
XBJA: If the Outcome Period has begun and the Fund has experienced an accelerated return, an investor purchasing Shares at that price may be subject to losses that exceed any losses of the Underlying ETF for the remainder of the Outcome Period and may have diminished or no ability to experience further accelerated return, therefore exposing the investor to greater downside risks.
These Funds are designed to provide point-to-point exposure to the price return of the Reference Asset via a basket of Flex Options. As a result, the ETFs are not expected to move directly in line with the Reference Asset during the interim period.
Investors purchasing shares after an outcome period has begun may experience very different results than funds' investment objective. Initial outcome periods are approximately 1-year beginning on the funds' inception date. Following the initial outcome period, each subsequent outcome period will begin on the first day of the month the fund was incepted. After the conclusion of an outcome period, another will begin.
BALT: Although the ETF targets a 20% buffer, it may fall into a range of 15-20%; there is no guarantee that the buffer will be within this range or that the Fund will provide the buffer.
Fund shareholders are subject to an upside return cap (the "Cap") that represents the maximum percentage return an investor can achieve from an investment in the funds' for the Outcome Period, before fees and expenses. If the Outcome Period has begun and the Fund has increased in value to a level near to the Cap, an investor purchasing at that price has little or no ability to achieve gains but remains vulnerable to downside risks. Additionally, the Cap may rise or fall from one Outcome Period to the next. The Cap, and the Fund's position relative to it, should be considered before investing in the Fund. The Funds' website, www.innovatoretfs.com, provides important Fund information as well information relating to the potential outcomes of an investment in a Fund on a daily basis.
The Fund only seek to provide shareholders that hold shares for the entire Outcome Period with their respective buffer level against reference asset losses during the Outcome Period. You will bear all reference asset losses exceeding the buffer. Depending upon market conditions at the time of purchase, a shareholder that purchases shares after the Outcome Period has begun may also lose their entire investment. For instance, if the Outcome Period has begun and the Fund has decreased in value beyond the pre-determined buffer, an investor purchasing shares at that price may not benefit from the buffer. Similarly, if the Outcome Period has begun and the Fund has increased in value, an investor purchasing shares at that price may not benefit from the buffer until the Fund's value has decreased to its value at the commencement of the Outcome Period.