May 4, 2023
The Final Hike
Tim Urbanowicz, CFA
Head of Research & Investment Strategy
Innovator Capital Management
The Fed hiked rates another 0.25% last week, bringing the discount rate up to 5%-5.25%. At this point, we think there is enough evidence to justify a pause, but not a pivot. On one hand, disinflation in goods is well under way, the labor market is starting to show signs of fatigue, and overall, activity is slowing. On the other hand though, disinflation within services is far less evident, and we believe core inflation remains too high. Cutting rates too soon poses the threat that financial conditions unnecessarily ease and unwind some of the progress that has already been made. Hence, our view that rate cuts are not coming in 2023.
It’s time to let previous hikes do the work, and we believe this is ultimately what the Fed will do. If this holds true, and May marked the end of the tightening cycle, what could this mean for investors? In this month’s newsletter, we look at this question by examining market trends around the “pause” historically, and discuss why there is still only one question that matters.
Rallies Around a Pause are Common
Hard landing or soft landing, investors always get excited around the possibility of a Fed pause, and understandably so. All the concern has been around how high rates will go, and a pause provides much needed relief.
The chart below provides evidence of this excitement historically, highlighting the return of the S&P 500 in the 12-months following the last hike in the cycle. In all but 1 instance, returns 12-months post pause, were positive, with an average return of 14.6%. Also, interesting to note, there were only 2 soft landings in the bunch below.
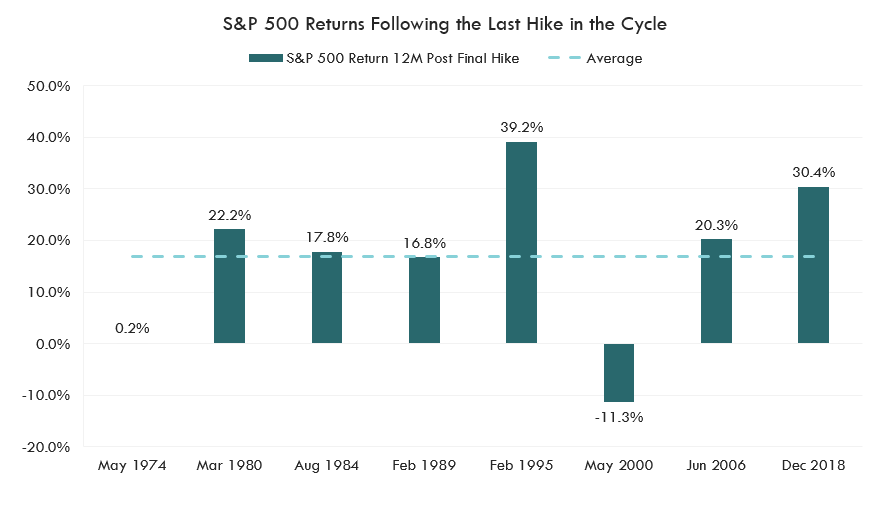
Source: Bloomberg LP, Innovator Research & Investment Strategy, S&P 500 Index, Data from 5/1/1974-3/31/2023. Periods shown represent the final hikes in previous rate tightening cycles. Past performance is not indicative of future results.
Even after the 2000 pause, while returns 12 months following were negative, there was still a smaller rally right after the pivot. We will revisit this in a bit, but we strongly believe keeping clients cautiously invested at a time like this is important.
Earnings Continue to Run…but not for Long
Historically, earnings trends after Fed pauses have been very consistent; as shown in the chart below, S&P 500 EPS have bottomed anywhere from 13 months to 38 months after the last Fed hike, but never before.
We also see the hit to earnings is typically delayed. In 7 of the 8 instances shown below, earnings actually continued to tick higher, for an average of 3.8 months after the final hike.
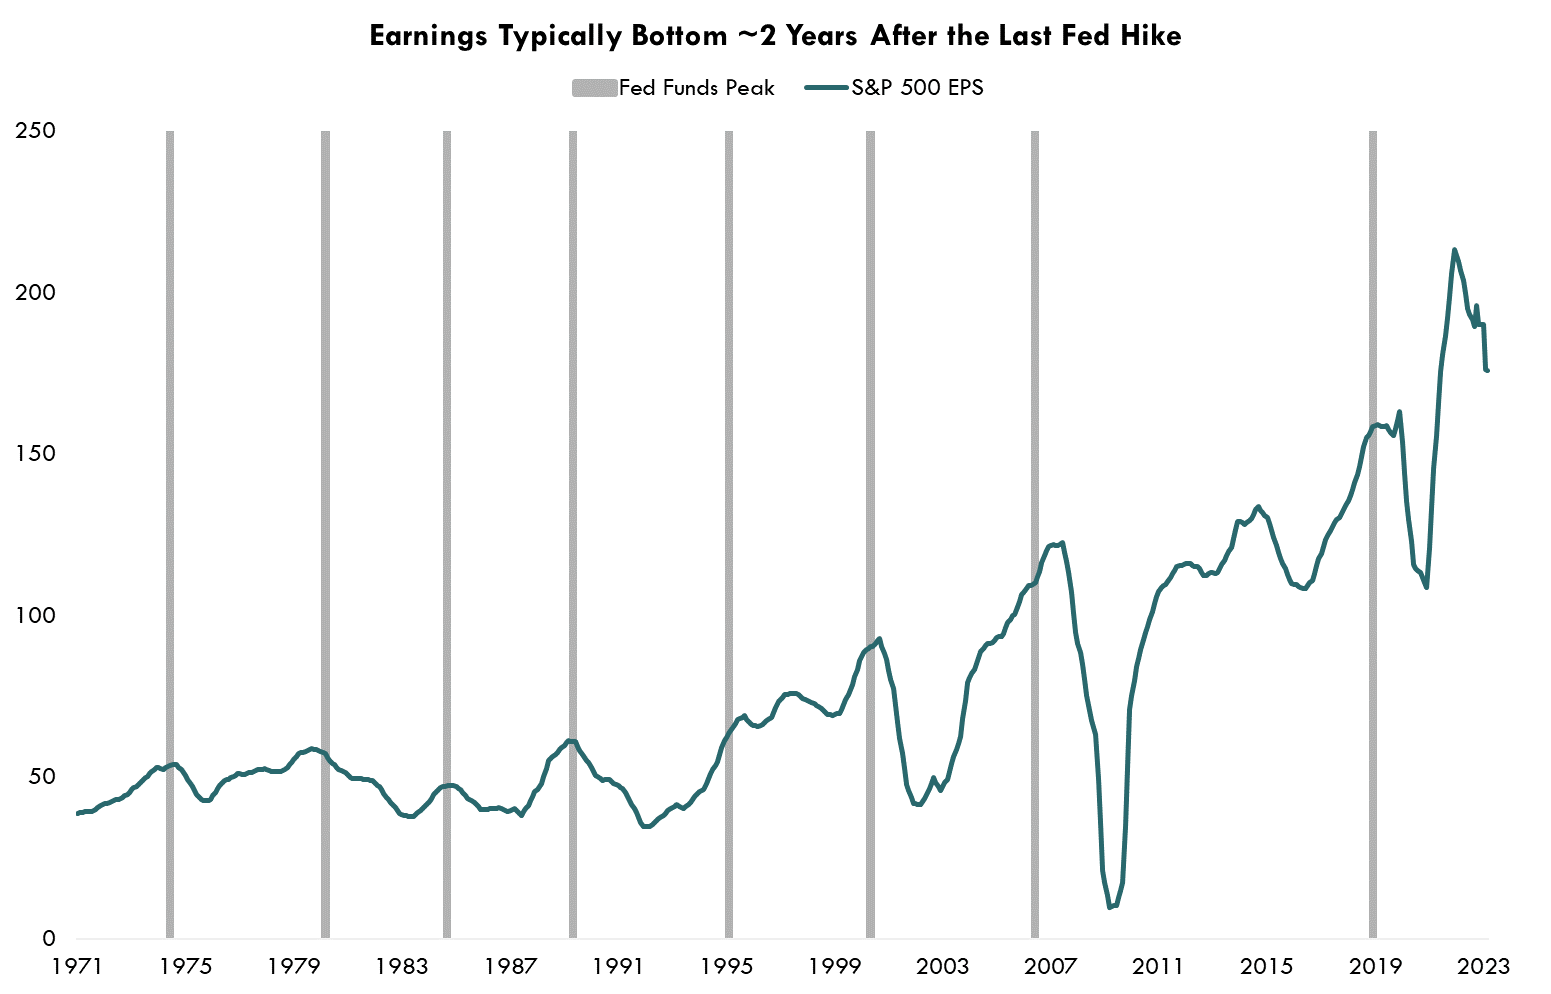
Source: Bloomberg LP, Innovator Research & Investment Strategy, Federal Funds Rate, S&P 500 Index, 1/31/1971-3/31/2023
When earnings do start to fall, however, the drop has not been pretty. As shown in the table below, on average, from final hike to the bottom, earnings have fallen 36.2%, with results ranging anywhere from +3.4% to -91.2%.
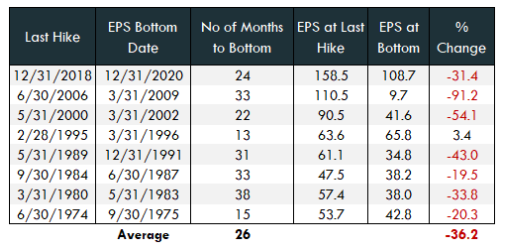
Source: Bloomberg LP, Innovator Research & Investment Strategy, Federal Funds Rate, S&P 500 Index, 6/30/1974-12/31/2018. Past performance is not indicative of future results.
In my view, this speaks to the delayed nature of monetary policy and also the impact disinflation has on earnings. High inflation often leads to margin expansion, as it has this time around to an extreme, and the disinflation process has the opposite effect. Needless to say, if history is our guide, we shouldn’t expect a bottom in earnings anytime soon.
| 2% and Under | 7.47 |
| Between 2% and 4% | 6.64 |
| Above 4 | 9.42 |
Source: Bloomberg LP, S&P 500 Index, Data from 4/1991-4/2023
The Only Thing that Matters
Will there be excitement over the pause? Will earnings grow in the short run? Maybe, but at the end of the day, there is only one question that matters…what type of landing will we have? From here, there are only three possible paths: a soft landing, no landing, or a hard landing.
In a soft -landing scenario, inflation would fall quickly, allowing the Fed to rapidly cut rates before the labor market takes a big hit, and the U.S. avoids a recession. Is it likely? No. But it is possible, and a scenario that would likely result in meaningful upside for equities. In a hard-landing scenario, unemployment would increase, tipping the U.S. economy into a recession, and in a no landing scenario, inflation would stay elevated, the economy would remain on firm footing, and further tightening would be likely. The no landing scenario just kicks the can down the road on a hard landing, in my view, and neither of the latter 2 scenarios would be favorable for equities.
Why it’s the Only Question that Matters
To show why this question holds all the cards, below we examine returns on the S&P 500 proceeding each of the last 4 Fed pauses. Interestingly, in all four instances, the equity market rallied, leading up to and proceeding the pause. However, after this initial run up, results were vastly different depending on the answer.
Soft Landing: 1995
After a cycle beginning in early 1994, the Fed paused in February of 1995. The S&P 500 railed 16% after the pause, the economy remained on solid footing, and the index railed an additional 25% in the 12 months following the start of rate cuts. Soft landing…big gain.
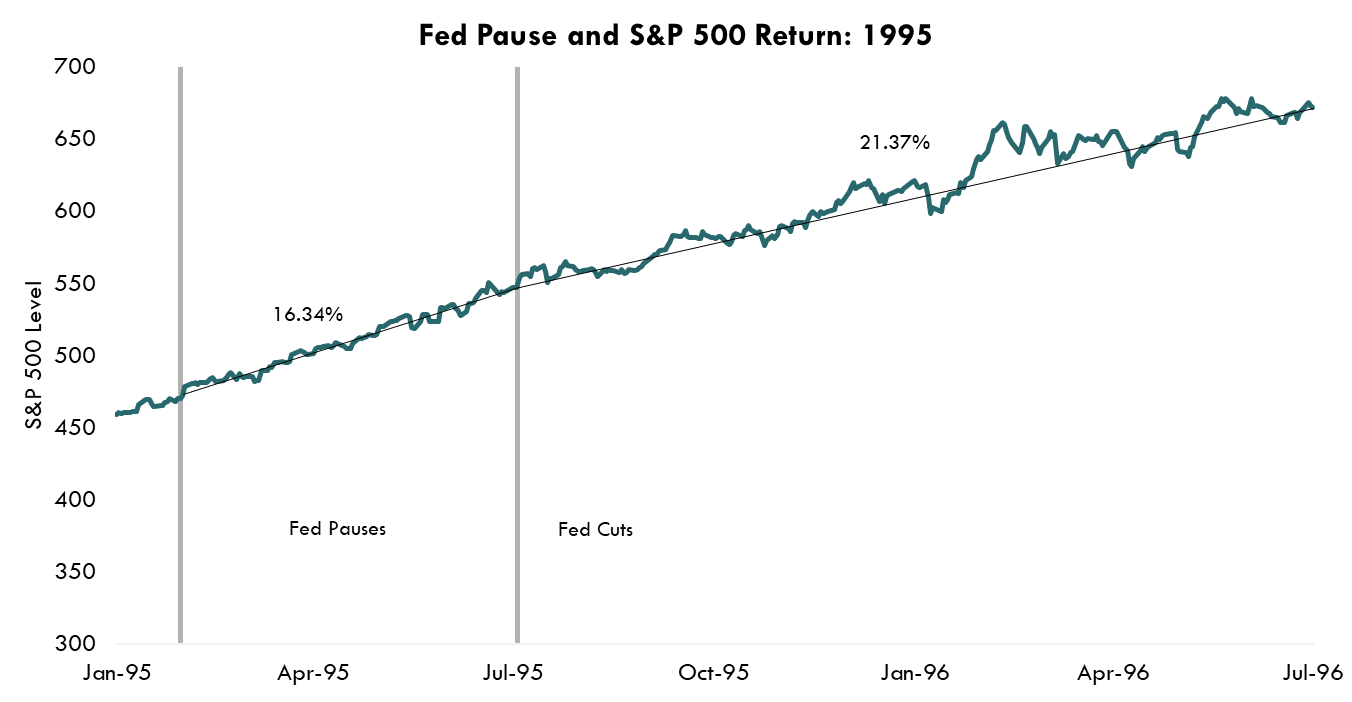
Source: Bloomberg LP, S&P 500 index, Data from 1/3/1995 – 7/3/1996
Soft Landing: 2019
After the pause in December of 2018, the S&P 500 rallied 18%, the economy remained strong and the index rallied an additional 11% after the first cut, to the pre-Covid high. Again, soft landing…big gain.
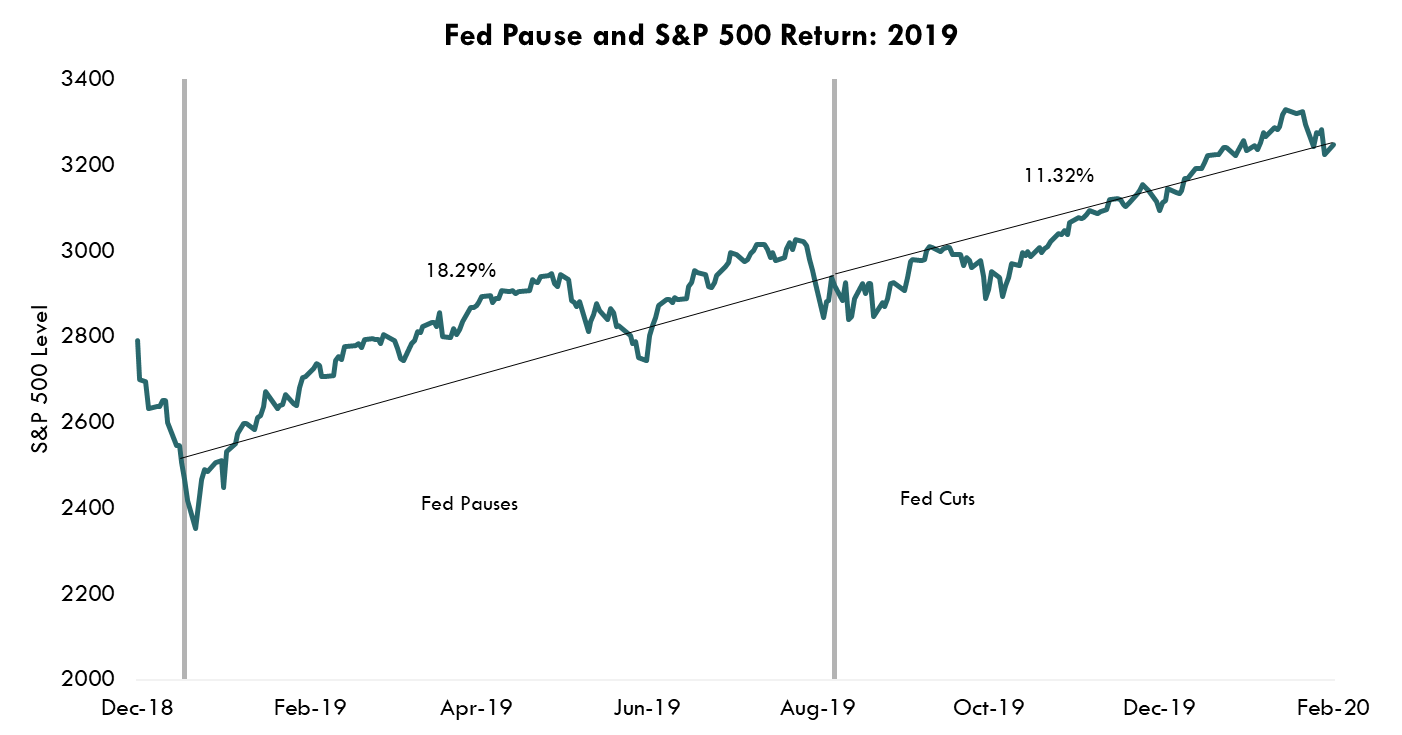
Source: Bloomberg LP, S&P 500 index, Data from 12/31/2018 – 2/3/2020
Hard Landing: 2000
The Fed kicked off a series of hikes in June of 1999, taking the policy rate from 4.75% to 6.5% in May of 2000. In the few months after the pause, the S&P 500 rose 4%, before falling 11% leading up to the first cut. Following the first cut in January, the market made another 7% head fake higher, before falling an additional 23% into September of 2001. Hard landing…big loss.
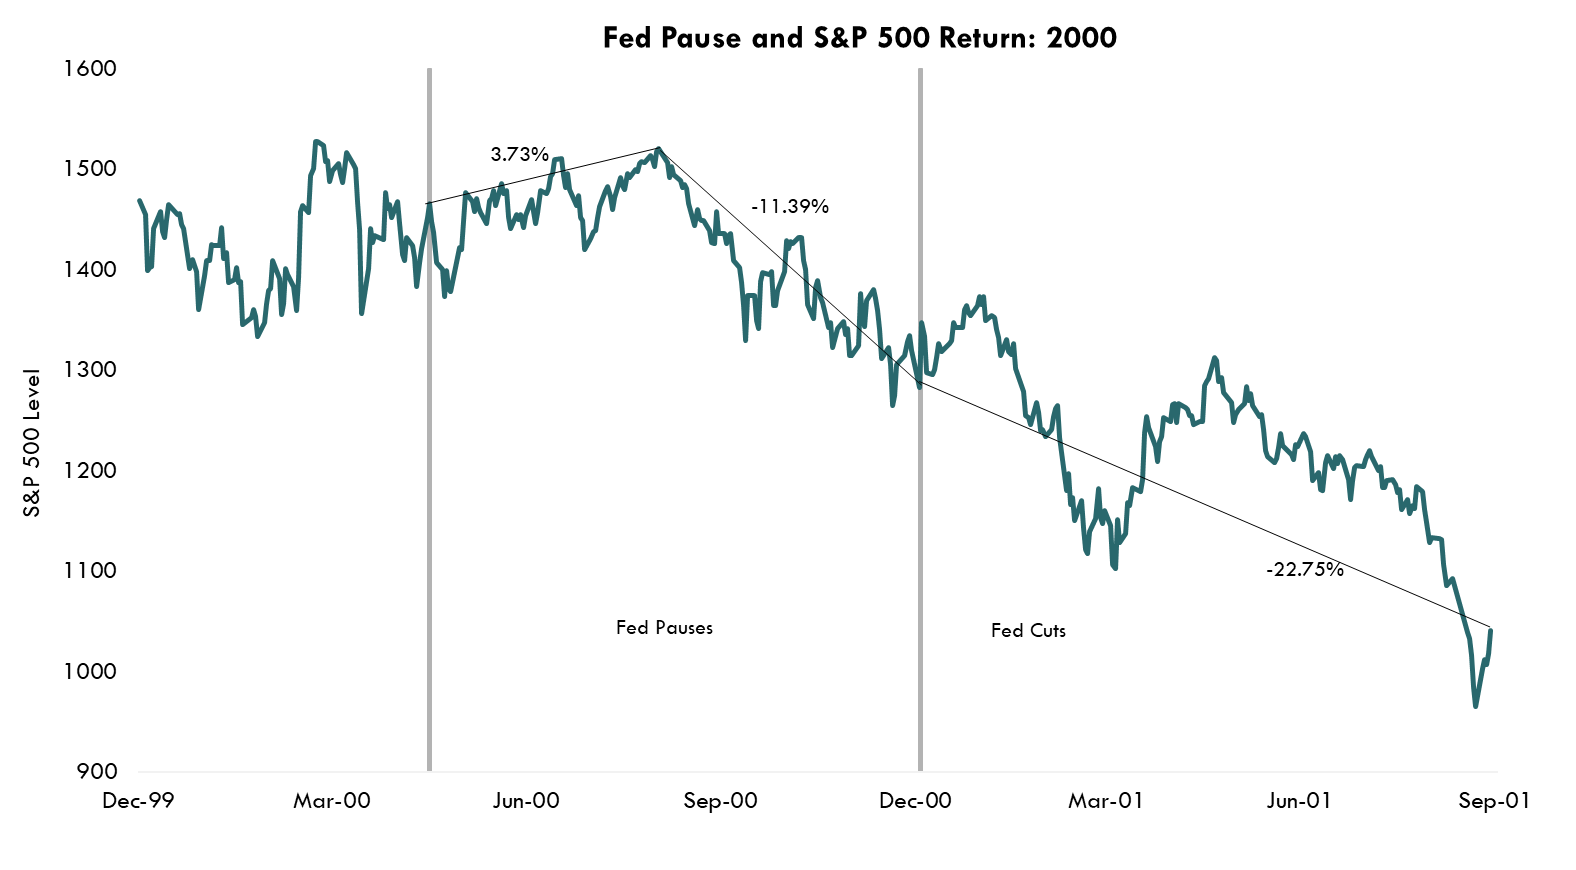
Source: Bloomberg LP, S&P 500 index, Data from 12/31/1999 – 9/28/2001
Hard Landing: 2007
After the pause in June of 2006, the S&P 500 rallied 16% and continued to tick higher after the first cut in September. After the initial rally, however, I think we all know what happened. Hard landing…big loss.
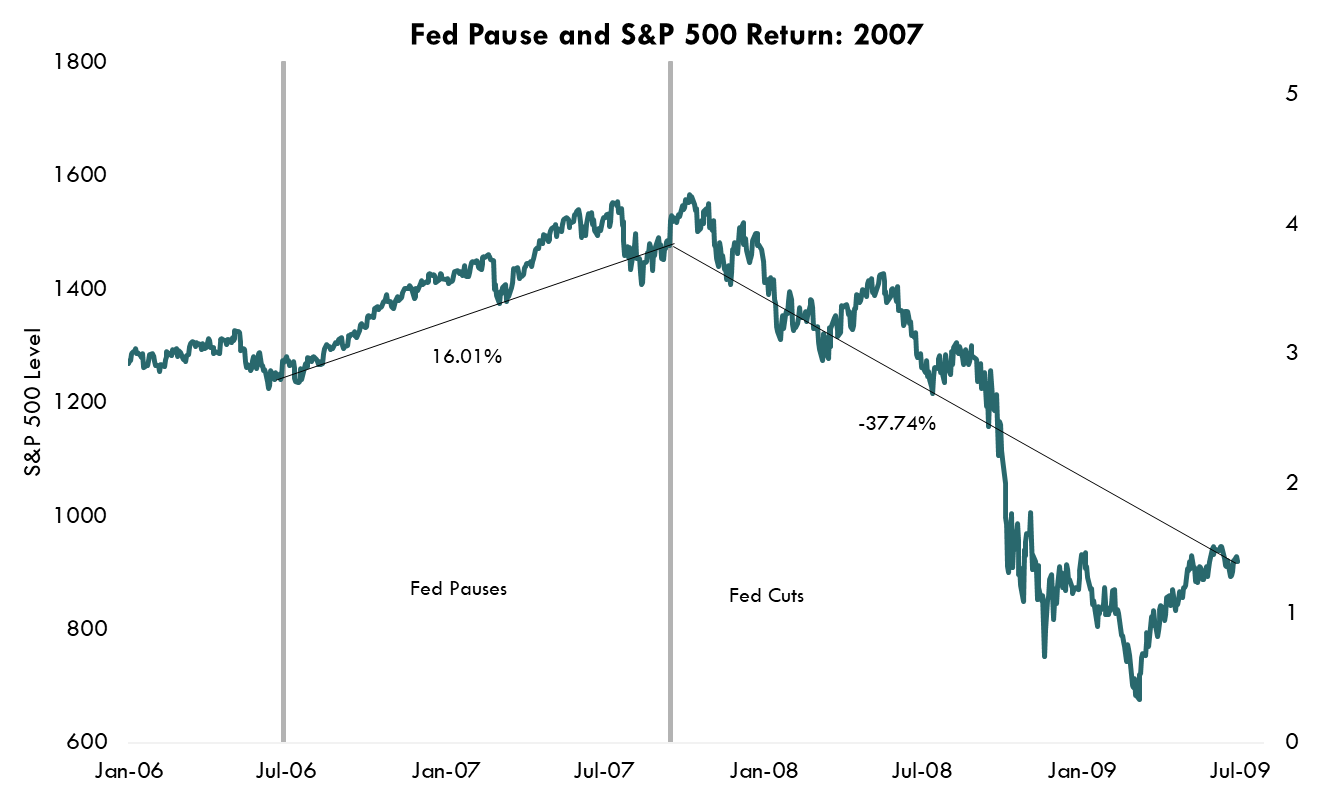
Source: Bloomberg LP, S&P 500 index, Data from 1/3/2006 – 7/1/2009
At the end of the day, short term moves may be a distraction from what really matters.
For the Portfolio
As I have highlighted in the last few newsletters, being risk aware, but not risk off, remains key at this point, and will likely be the case for some time. A hard landing or no landing appear to be most likely, but a soft landing is still possible. Regardless, as has been the case historically, dips and rallies are common in the short term. Market timing is difficult, if not impossible, and the importance of keeping clients cautiously invested is key, and may be for some time.
It is not possible to invest in an index.
Discount rate refers to the interest rate charged to commercial banks and other financial institutions for short-term loans they take from the Federal Reserve Bank.
Earnings per share, or EPS, is a company's net profit divided by the number of common shares it has outstanding.
S&P Earnings Per Share is the average earnings per share of all S&P 500 companies. Earnings per share is a company's net profit divided by the number of common shares it has outstanding.