April 11, 2023
The Storm Clouds are Getting Closer
Tim Urbanowicz, CFA
Head of Research & Investment Strategy
Innovator Capital Management
After getting into a consistent rhythm, it’s easy to assume things will always remain the same, even when they will not. I was reminded of this recently. My two boys had been heavy into the Cars movies for 3+ years. Birthdays, Christmas, you name it, all they wanted were new characters from the movie. But finding the cars they wanted was no easy task! So anytime my wife or I saw one on their list, we would buy it, and put it away for the right time. Over time, we slowly accumulated quite the stash of unopened cars that we thought we could use for years into the future. Unfortunately, their interest quickly shifted, and we were stuck holding the bag... literally. Thankfully, the secondary market for cars (eBay), is robust!
I believe we are about to see a similar turning point in the market. Up to this point, investors have been laser focused on rate hikes, when the Fed will pause, what the terminal rate will be, and when the pivot will take place. Good news has been bad news, and vice versa. Signs of economic strength have driven concerns of higher inflation and a higher terminal rate, while weaker economic data has driven risk on excitement of a Fed pivot. This is the rhythm we have gotten used to. The tides, however, appear to be turning. Hiking rates from 0% to 5% doesn’t come without a cost, and I believe we are reaching a critical point in the cycle, where the bill is coming due. Bad news will once again be bad news.
As shown in the chart below, with the exception of the COVID-driven recession, each of the last seven downturns have taken place with the Fed Funds rate above 5%.
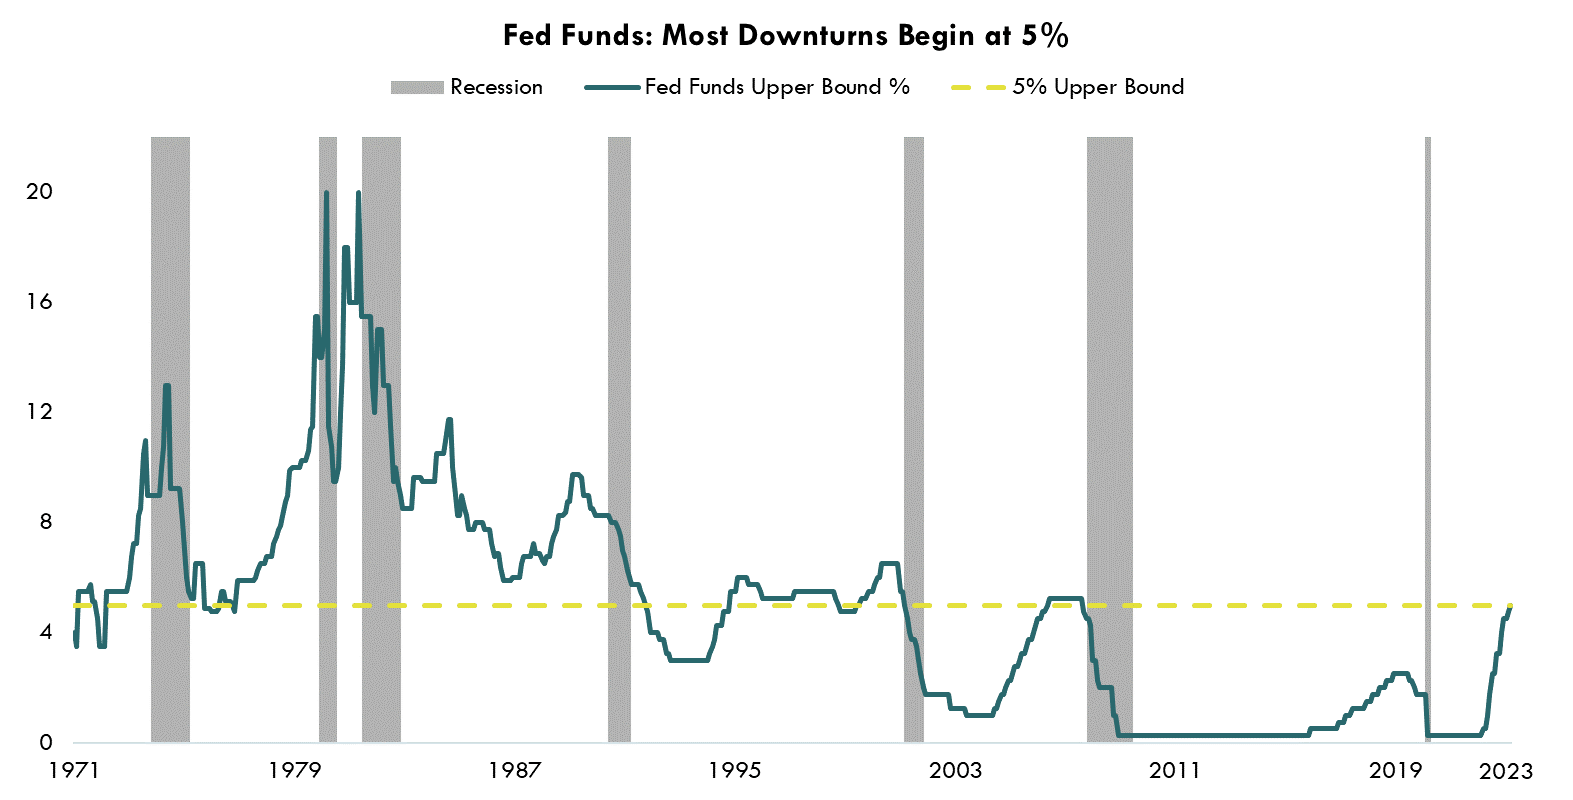
Source: Bloomberg LP, Fed Fund Upper Bound, NBER Recession Definition, 1/29/1971 – 3/31/2023
Whether or not we get one more rate hike in May, the storm clouds are getting closer and the real question now is, how much damage has already been dealt? In this month’s newsletter, I take a closer look and discuss why we believe investors in risk assets are far too complacent.
The Storm Clouds - Where do we Stand?
While there are many market indicators to watch, below are a few that I believe are of particular importance:
The ISM Purchasing Managers Index due to its timeliness and insights into the ebb and flow of business activity; Consumer Spending/Savings given how crucial the consumer is to the US economy; and the Yield Curve, given the ridiculous accuracy it has had historically in predicting economic downturns. Here is what each is telling us today:
ISM Manufacturing Survey
After peaking in March of 2021, the ISM Purchasing Managers Index has been on a steady decline ever since. The latest reading of 46.3 was the lowest since the pandemic. No doubt that growth is slowing and recession risks are high, and an April print in the same ballpark would certainly be cause for concern.
Looking back to 1970, there have been 12 separate instances where the index had consecutive prints of 46.3 or lower. In 11 of the 12 instances, the economy was either in or heading into a recession.
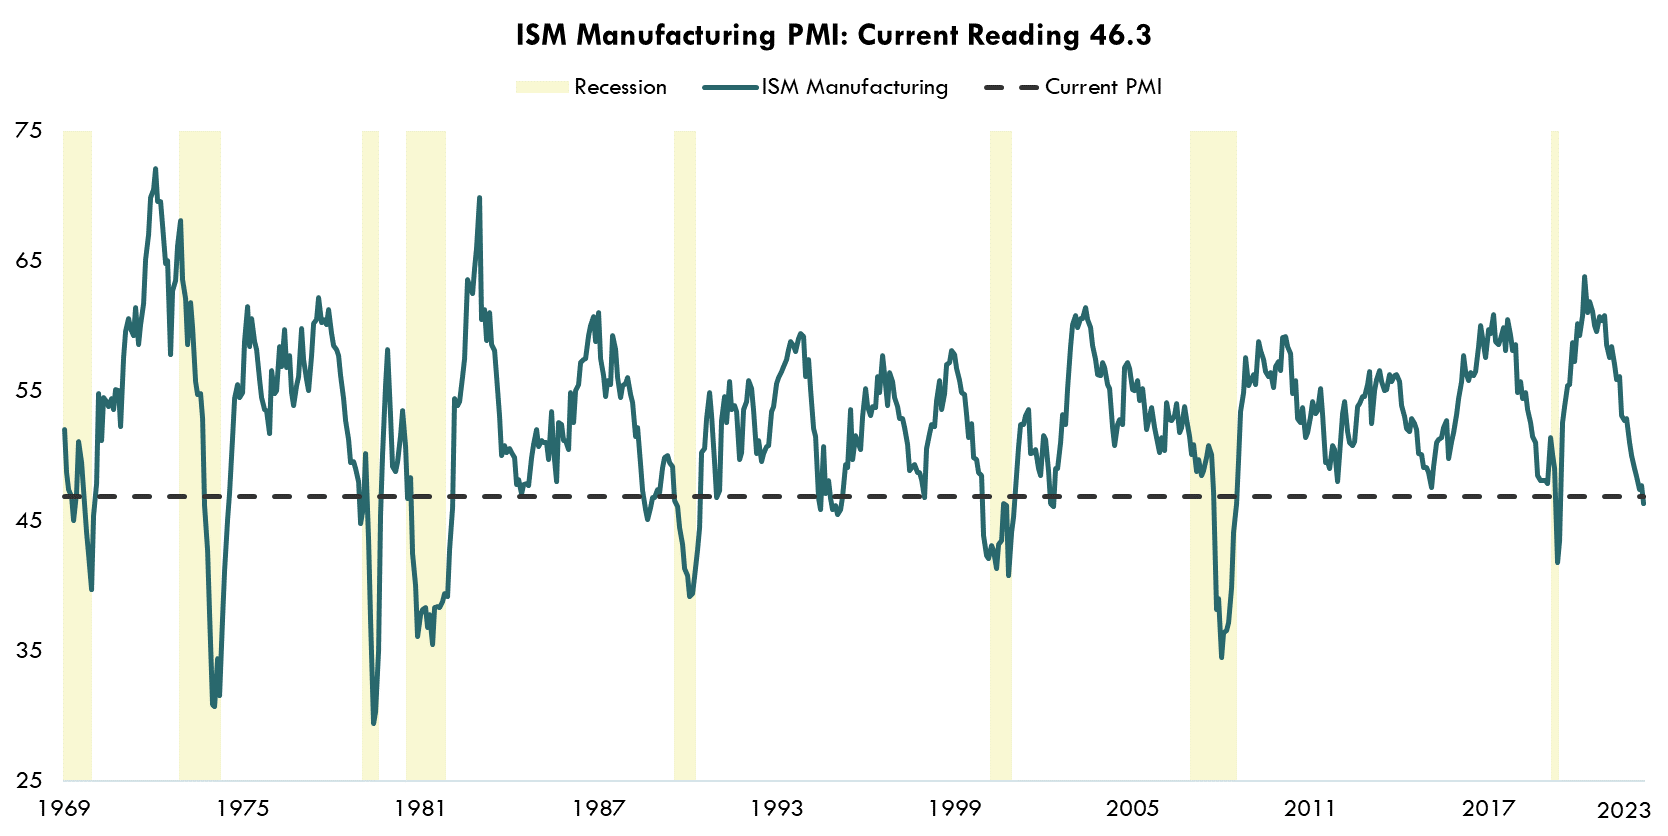
Source: Bloomberg LP, ISM Manufacturing Survey, 12/31/1969 – 3/31/2023
Upon breaching 46.3 historically, all recessions have occurred within 13 months. Needless to say, we will be watching the April print closely.
Spending, Savings, & the Cost of Credit
Consumer spending, which is the backbone of the US economy, has been extremely resilient up to this point in the cycle. This has in part been driven by strong employment and robust wage gains, but savings has also been a catalyst. As shown in the chart below, savings has been on a steep decline since the pandemic, supplementing wages, to help drive spending.
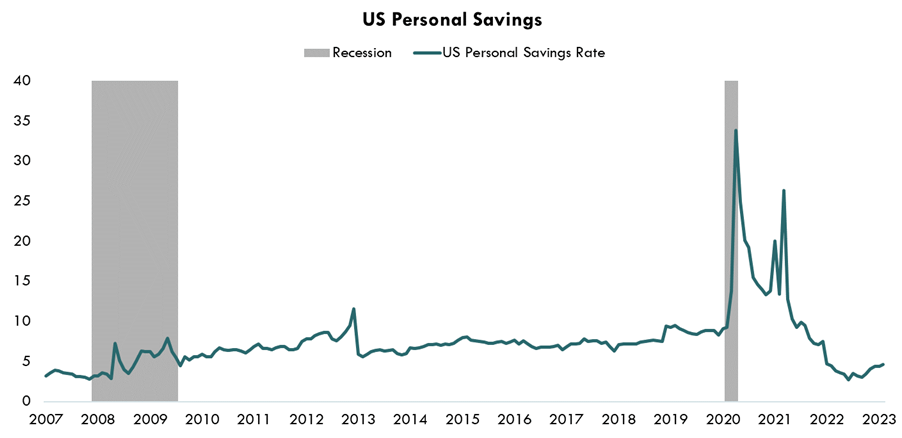
Source: Bloomberg LP, Federal Reserve Bank of St Louis, 1/1/2007 – 2/1/2023
But this is starting to change…the well is running dry. Mid-way through 2022, consumer savings hit its lowest level since the financial crisis, and now 36% of Americans have more credit card debt than savings. Households are beginning to limit their spending in an attempt to increase savings (see recent uptick in chart above). Interestingly, this is a similar pattern we saw throughout the financial crisis, as well as other recessions past. Savings were depleted near the end of 2007, and right around the onset of the financial crisis, households began to hoard cash.
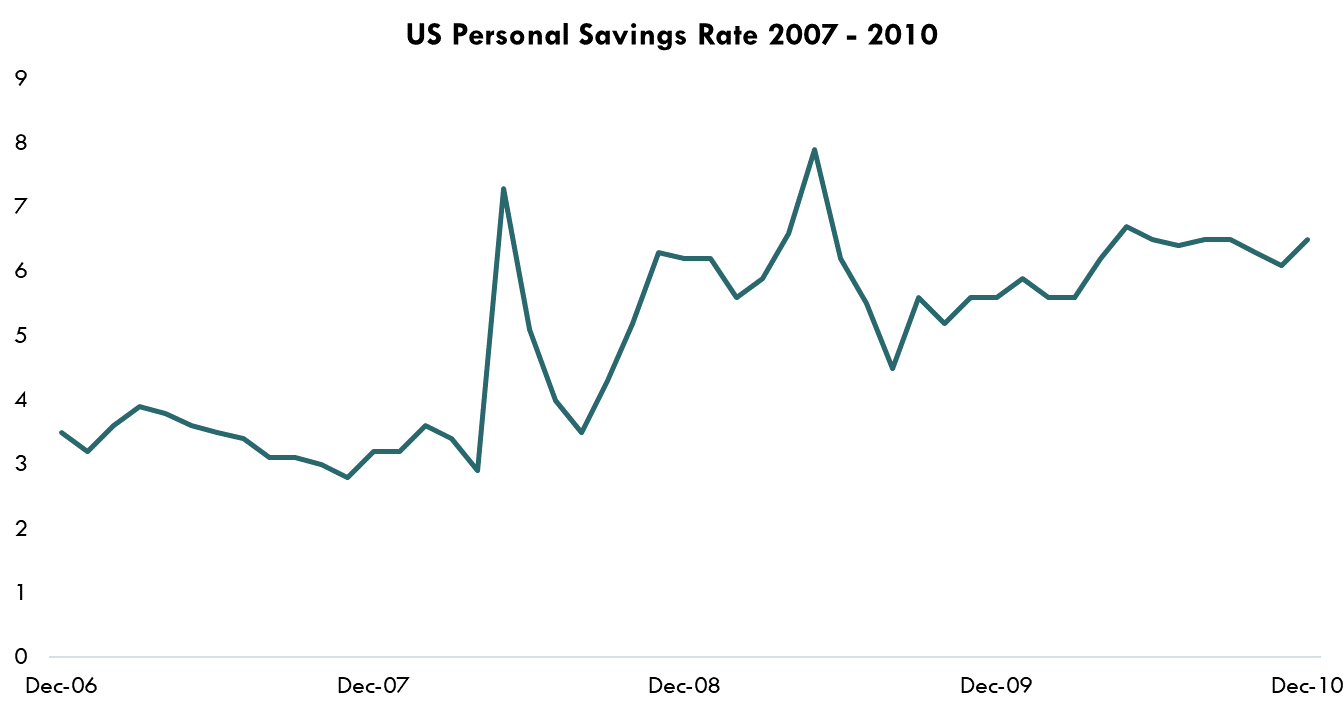
Source: Bloomberg LP, US Personal Savings Rate, 12/31/2006 – 12/31/2010
The rising cost of, and more restrictive access to, capital is also likely to add pressure to the consumer. All in all, we expect spending to continue to slow in the coming months as these trends continue to play out.
The Yield Curve
Few indicators have the track record the yield curve has. Every recession in the last 60 years has been preceeded by an inversion of the 3-month and 10-year treasury yields…100% accuracy.. Pretty strong track record to say the least.
As shown in the chart below, the current inversion is the third largest in history. A clear warning signal, and one that been flashing for months.
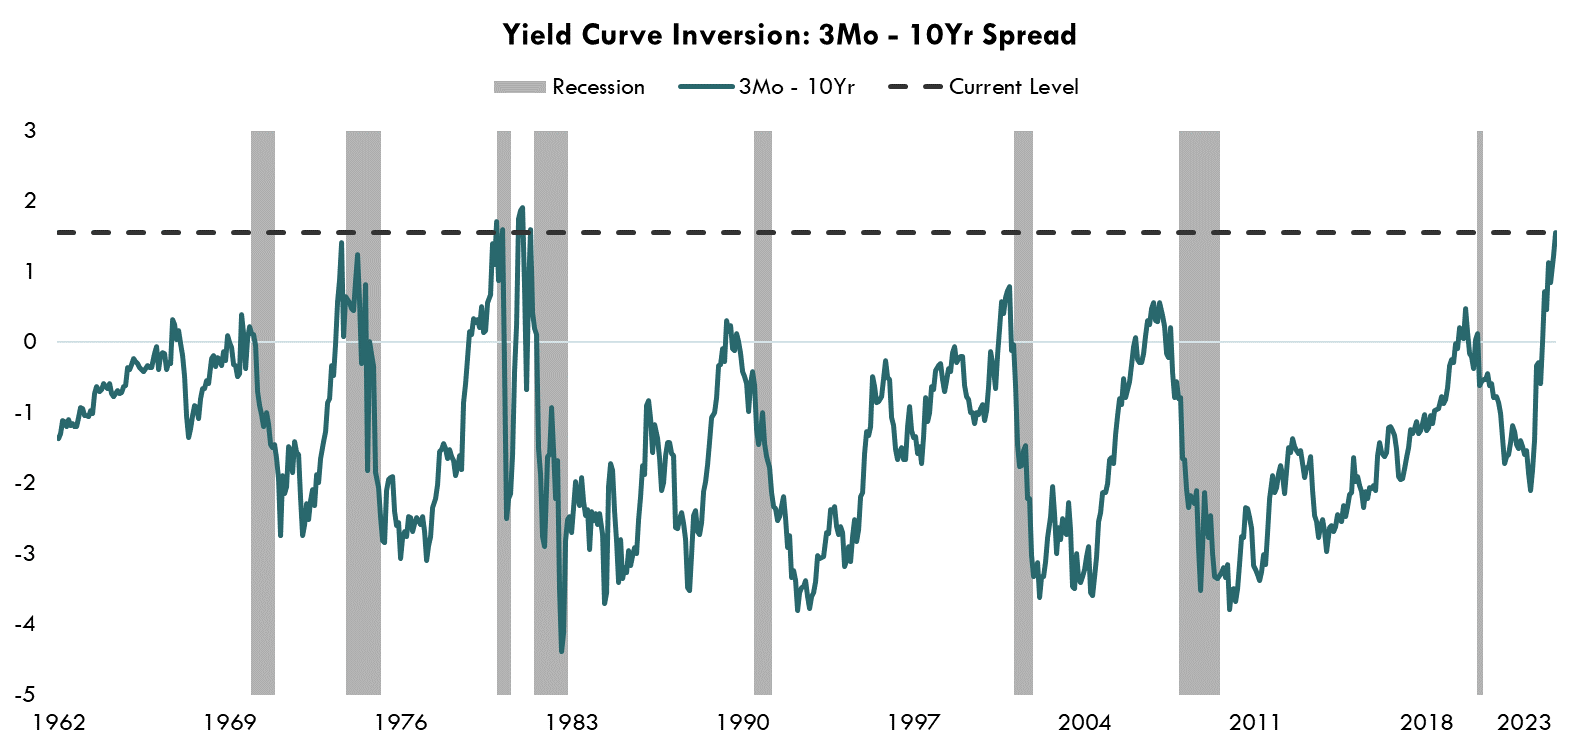
Source: Bloomberg LP, US Treasury 3-Month and 10-Year Generic Treasury Yield, Data from 1/31/1962 – 4/10/2023
Risk Assets... Nothing to See Here
What I find particularly interesting, is that in light of all these warning signs, risk assets appear unphased. Equites rallied hard in Q1 with the NASDAQ rising nearly 20%! It’s difficult to look at a move like that and not want to re-risk the portfolio. But buying equities just because they are going up is not a recipe for success. Recession or no recession, we are in the early stages of an economic downturn and inflation remains a serious threat.
With all that said, we have a cautious stance when it comes to risk assets. U.S. equities are expensive, fundamentals are deteriorating, and high yield credit spreads are nowhere near recessionary levels. As an example, the chart below shows how far off high yield credit spreads are from past recessionary levels.
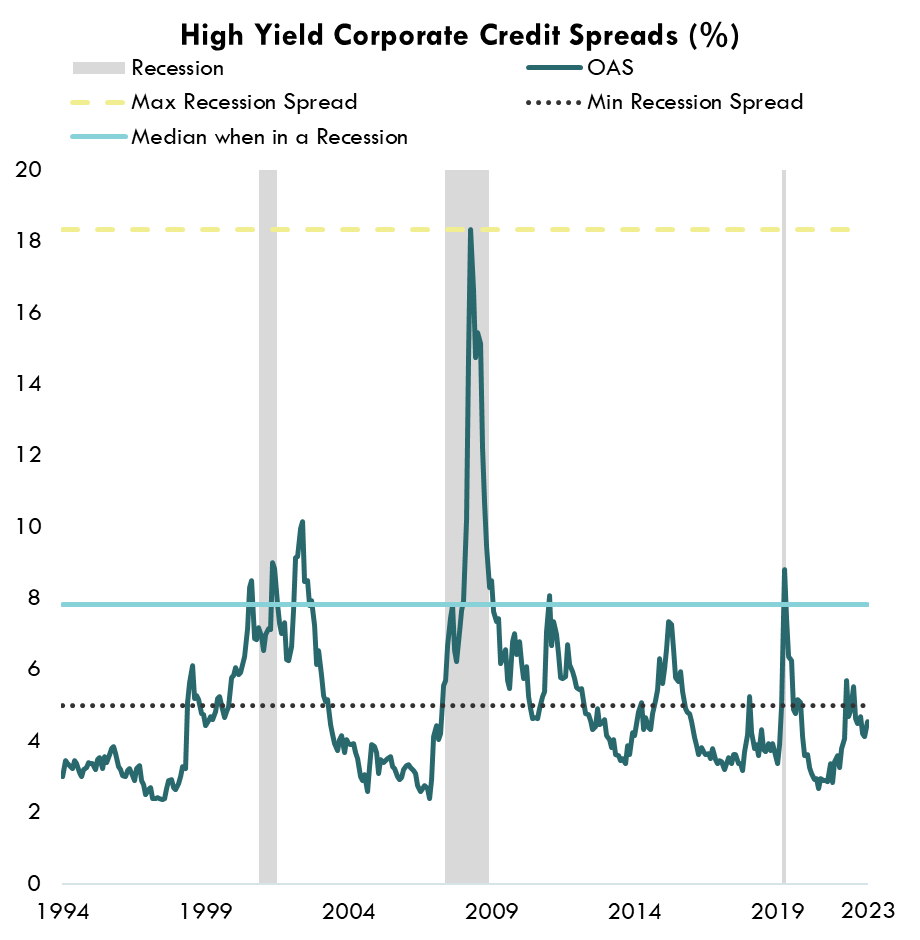
Source Bloomberg LP, 2/28/1994-3/31/2023, Bloomberg US Corporate High Yield Average OAS
Given what many key indicators are signaling, this complacency is surprising.
For the Portfolio
We are now entering the most challenging point of the hike cycle where we assess the damage dealt. Below are a few ideas to help navigate around the storm clouds:
#1- Risk aware over risk on is the name of the game. Buffered and hedged equity strategies may be a good way to maintain equity exposure and potentially protect portfolios in another drawdown.
#2- Focus on high-quality fixed income and income strategies with built in risk management. High yield investors are not being compensated for the risk they are taking. Stepping down in credit quality to grab yield could be costly at this point in the cycle.
The terminal rate is the ultimate interest rate level that the Federal Reserve sets as its target for a cycle of rate hikes or cuts.
Fed funds futures are liquid monthly futures contracts that investors use to bet on or hedge against short-term interest rate fluctuations.